Precision Soil Sampling and Grid Size
Variable-rate application of lime and fertilizer is a common practice in precision agriculture to address soil nutrient variability within agricultural fields. Traditional soil sampling methods involve collecting one or more composite soil samples randomly within the field (Figure 1a), which provides, at most, an averaged representation of soil nutrient status and often results in under- and overapplication of lime and fertilizer.
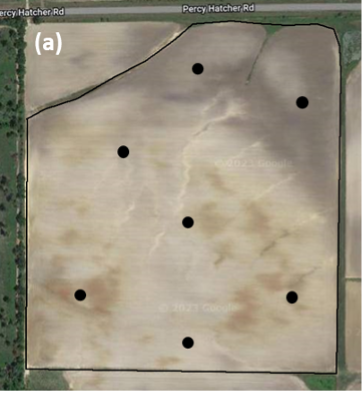
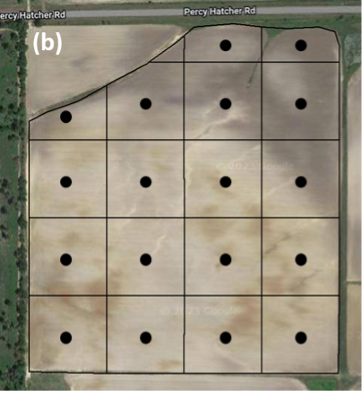
To properly identify and address soil nutrient variability within agricultural fields, grid-based soil sampling is one of the most commonly used methods by crop consultants and growers in the southeastern U.S. For grid sampling, a field is divided into uniformly sized grids (Figure 1b), and a composite soil sample is taken from each grid to determine the spatial soil pH and nutrient variability within the field. The grid-based soil sampling method is widely used because of its ease of implementation, and it requires no previous knowledge of field history and/or management practices utilized in the field.
The size of the grids is one of the most important considerations for grid soil sampling as it affects the sampling resolution and costs. Grid size can range from 1 to 5 acres, but a smaller grid size of ≤ 2.5 acres is generally recommended to capture the spatial nutrient variability within fields in the southeastern U.S. However, a smaller grid size also means more soil samples and greater costs associated with soil analysis.
Larger grid sizes of ≥ 5 acres currently are most commonly used by consultants and growers to reduce soil sampling and analysis costs. This approach, however, presents an argument about the effectiveness of larger grids in accurately depicting the spatial nutrient variability within fields. Considering fertilizer costs and the motivation to be more efficient with fertilizer applications, growers are interested in making informed and improved nutrient management decisions for their farms. Therefore, it’s critical to address questions about the effectiveness of different grid sizes in accurately depicting soil nutrient variability and the effect on application accuracy and economics on site-specific nutrient management.
Study on the Effectiveness of Different Grid Sizes
To determine if there is an optimal grid size for soil sampling that captures the most variability and is also cost-effective, precision soil sampling on five different grid sizes of 1.0, 2.5, 5.0, 7.5, and 10.0 acres was conducted in nine fields ranging from 20 to 93 acres in the Coastal Plains region in South Georgia in 2022. Additionally, high-intensity soil sampling (approx. one sample per 0.5 acre) was conducted to obtain a reference layer that was assumed to represent actual spatial nutrient variability within each field.
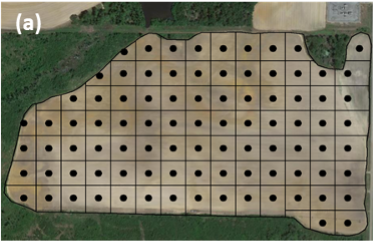
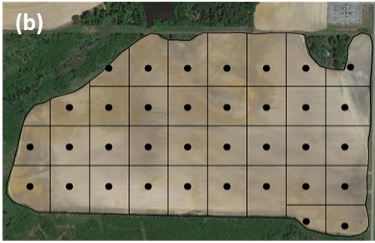
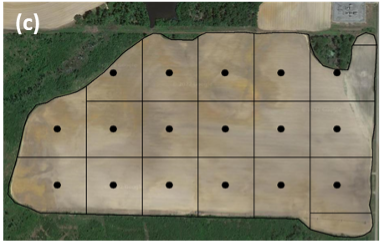
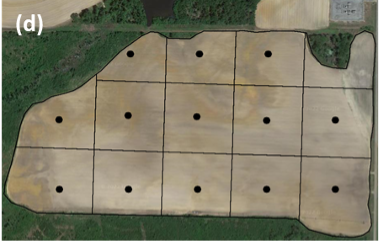
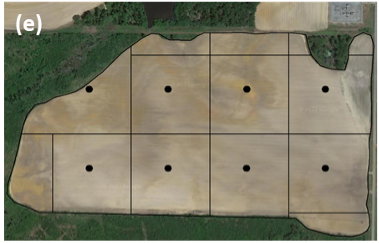
Soil sampling maps for different grid sizes were created using SMS Advanced software and are shown in Figure 2 for one of the fields used in this study. All soil samples were analyzed at the University of Georgia (禁漫天堂) Agricultural and Environmental Services Laboratories. From these soil test results, spatial maps for all nine fields were created for soil pH, phosphorus (P), and potassium (K). Additionally, corresponding variable-rate prescription (Rx) maps were created, based on each grid size and the high-density soil sampling results. For the Rx maps, we used the UGFertex website to generate 禁漫天堂 fertility recommendations to achieve a cotton yield goal of 1200 lb/acre. The Rx maps were spatially analyzed and compared to assess the application accuracy (%) of different grid sizes compared to the reference Rx maps.
To perform an economic analysis, the amount of lime and fertilizer recommended for each grid size along with recent lime and fertilizer prices (lime = $50/ton, P = $0.67/lb, and K = $0.68/lb) from the 2022 禁漫天堂 Row Crop Budgets were used to compute the material costs ($/acre) for each grid-size strategy. Further, we used a fixed soil-sampling cost of $4/acre and a soil sample analysis fee of $6 per sample, based on the commonly charged fees by consultants and laboratories in the southeastern U.S. The total application cost ($/acre) for each grid size included soil sampling costs, sample analysis costs, and material costs for lime, P, and K.
Application Accuracy of Different Grid Sizes
To illustrate visual differences in the nutrient variability depicted by different grid sizes, Figure 3 depicts six soil pH maps based on different grid sizes for one of the fields used in this study.
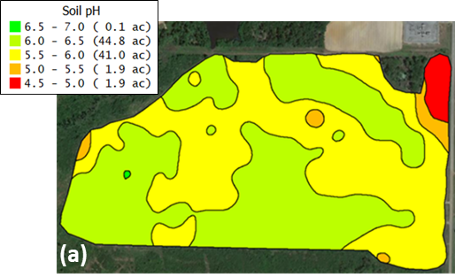
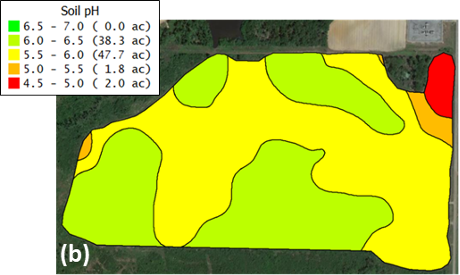
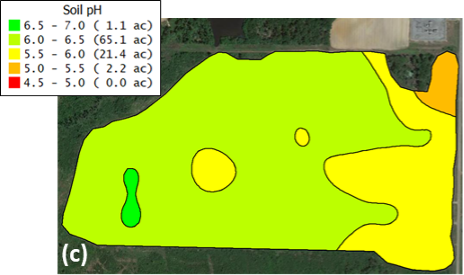
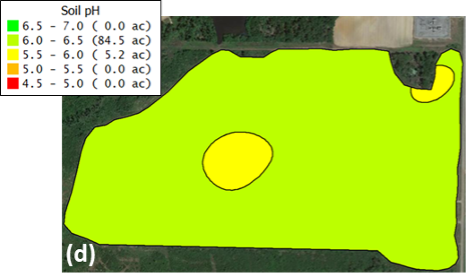
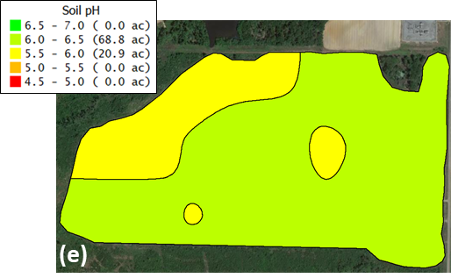
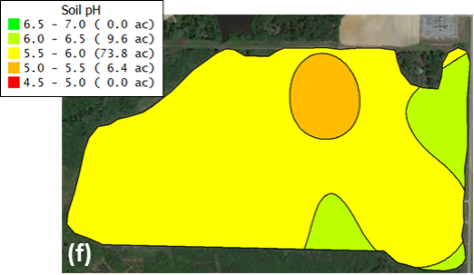
The soil pH map based on a 1-acre grid size (Figure 3b) is closely associated with the reference map (Figure 3a), indicating that soil sampling on a 1-acre grid size is adequate at accurately depicting the spatial nutrient variability within the fields. The soil pH map based on sampling with a 2.5-acre has some association with the reference map but is not as accurate as the 1.0-acre grid map and also is more variable across the whole field. The association is reduced considerably among the soil pH maps thereafter (5.0, 7.5, and 10.0-acre grid sizes), suggesting that larger grid sizes (≥ 5 acres) are ineffective in accurately depicting spatial nutrient variability within fields.
Table 1 shows the application accuracy (%) and material costs ($/acre) for lime, P, and K, averaged across all nine fields for different grid sizes. The values in parentheses also represent the number of fields that had an application accuracy ≥ 80% for each nutrient. The trend for application accuracy was similar to the maps in Figure 3, where it was consistently greatest (> 80%) for the grid size of 1.0 acre and then reduced considerably (≤ 76%) with an increase in grid size.
| Grid Size (acres) | Average application accuracy (%) | Average material costs ($/acre) | ||||
|---|---|---|---|---|---|---|
| Lime | P | K | Lime | P | K | |
| 1.0 | 89(9) | 86(8) | 84(8) | 28.1 | 25.6 | 44.3 |
| 2.5 | 76(4) | 63(3) | 60(1) | 27.5 | 28.1 | 45.9 |
| 5.0 | 73(3) | 55(1) | 53(0) | 27.5 | 33.6 | 42.4 |
| 7.5 | 64(2) | 57(1) | 48(0) | 25.4 | 29.2 | 43.1 |
| 10.0 | 52(0) | 52(0) | 49(0) | 27.2 | 27.3 | 45.1 |
| Note. The values in parentheses indicate the number of fields that had an application accuracy ≥ 80%. Data represent values averaged across the nine fields in this study. | ||||||
Analyzing the results by each field used in this study, the data showed that the application accuracy was ≥ 80% for at least eight out of all nine fields for the grid size of 1.0 acre across all three nutrients (i.e., lime, P, and K). For the grid size of 2.5 acres, it was ≥ 80% for only four fields for lime, three fields for P, and one field for K, which suggests that soil sampling on 2.5-acre grids may be appropriate for some fields depending on the amount of spatial nutrient variability present within the field.
For grid sizes of 5.0 acres or larger, the application accuracy was ≥ 80% for only three fields for lime, one field for P, and none for K. It is worth noting that 5.0 acres is the most commonly used grid size for soil sampling in the southeastern U.S., including Georgia, and these results indicate that the 5-acre grid size is not effective in adequately representing spatial nutrient variability in most fields.
The 10-acre grid size didn’t perform well — there was an average application accuracy of approximately 50% across all three nutrients, and no fields with an application accuracy ≥ 80%. Some fields in the southeastern U.S. are soil-sampled at grid sizes as large as 10 acres and these data suggest that the application accuracy in those fields may only be as good as 50% in most cases.
Economics of Different Grid Sizes
One of the biggest factors for consultants and growers to conduct soil sampling on larger grids (≥ 5 acres) is to reduce the cost associated with soil samples. However, that decision is only based on the soil-sampling costs and does not consider the effect of the soil-sampling grid size on the costs of lime and fertilizer. Grid size affects application accuracy which influences the amount of lime and/or fertilizer applied in the field and hence the application costs.
Considering the material cost data listed in Table 1, the average material cost per acre for lime, P, and K does not increase as grid size increases. This is largely because of the varying amounts of under- and overapplication associated with each grid size. The material cost ($/acre) for lime for the 1.0-acre grid size is only $0.60 more per acre than the cost for 2.5 and 5.0-acre grid sizes. Similarly, at the 1.0-acre grid size, the material cost for P is the lowest among all the grid sizes, whereas for K, it is lower than the cost for 2.5 and 5.0-acre grid sizes. As stated earlier, application accuracy decreases with an increase in soil sampling grid size, and the varying material costs at larger grid sizes compared to a 1-acre grid size is because of the large amount of overapplication or underapplication within the fields.
When considering total application costs which include soil sampling, soil analysis, and material cost for each grid size, it is evident from Figure 4 that the total application cost does not change considerably between different grid sizes. In fact, the total application cost for the 1.0-acre grid size is less than the total costs for grid sizes of 2.5 and 5.0 acres. This is because of an increase in overapplication with an increase in grid size.
Contrarily, the total application costs for 7.5 and 10.0-acre grid sizes are less than other grid sizes. However, it is worth noting that not all of that cost reduction is because of the reduced sampling costs—it comes from the underapplication of nutrients because of low application accuracy (56% and 51%, respectively) at these grid sizes. The application inaccuracies associated with larger grid sizes, especially the underapplication of nutrients, can further limit crop yields in some fields.
These findings suggest that larger grid sizes may help in lowering soil sampling costs but not without the added expense of reduced application accuracy and increased application costs in some fields. Additionally, while overapplication increases the total application costs because more material is applied per acre than needed, the overapplication of lime and/or fertilizer within some fields can affect crop yield potential—especially if the nutrient levels are critically low—and therefore can impact profitability.
Optimal Grid Size for Soil Sampling
The unpredictable amount of spatial nutrient variability that exists within fields in the southeastern U.S. indicates the need for precision soil sampling by using smaller grid sizes. Based on the data presented in this publication, a grid size of 1.0 acre is most effective for precision soil sampling to capture the spatial nutrient variability within most of the fields while also providing the greatest return on investment by being efficient with lime and fertilizer application. In some fields, the 2.5-acre grid size also showed an application accuracy of ≥ 80% for all three nutrients (lime, P, and K), and less or comparable application costs compared to larger grid sizes of 5 acres or greater, thus making it another viable grid size to sample for certain fields. Among these two grid sizes, the choice of soil sampling grid size will depend on the amount of variability and how much historical information is available for a given field.
In general, it is recommended that soil sampling on 1-acre grids should be conducted in a field initially during the first year of production, in a new field, or when there is no historical information available to get a baseline estimate of soil nutrient variability within a field. In subsequent years, the baseline information along with other data—such as soil type, soil electrical conductivity, aerial imagery, and/or crop yield—should be used to either transition to 2.5-acre grid sampling or a zone-based soil sampling approach as it tends to provide a better combination of accuracy and cost-effectiveness. The zone-based soil sampling method and considerations will be discussed in greater detail in a future publication. For precision soil sampling to remain valuable and provide any realistic depiction of soil nutrient levels in the southeastern U.S., grid size should not exceed 2.5 acres in most fields.
Additional author: Matthew Tucker, graduate research assistant, Crop and Soil Sciences
References
AgLeader Technology. (n.d.). SMS Advanced [Computer software].
Plank, C. O., Harris, G., & Hitchcock, R. (2001). UGFertex. University of Georgia Cooperative Extension.
Status and Revision History
In Review on Apr 18, 2024
Published on May 14, 2024
